prometheus监控使用-1
之前研究 k8s 时候用部署过 prometheus,使用它来监控 k8s 集群,不过也是照文档操作,并没有深入研究,最近大概看了一下
安装
prometheus 安装比较简单,下载编译好的二进制文件,修改好配置文件,直启动即可。可以在https://github.com/prometheus/prometheus/releases
下载最新版本。由于网络原因不能下载的,可在我的站点下载
https://dl.cactifans.com/prometheus/prometheus-2.1.0.linux-amd64.tar.gz
解压
tar zxvf prometheus-2.1.0.linux-amd64.tar.gz
解压之后,会有一个默认的配置文件,可以直接使用这个配置文件启动
./prometheus --config.file=prometheus.yml
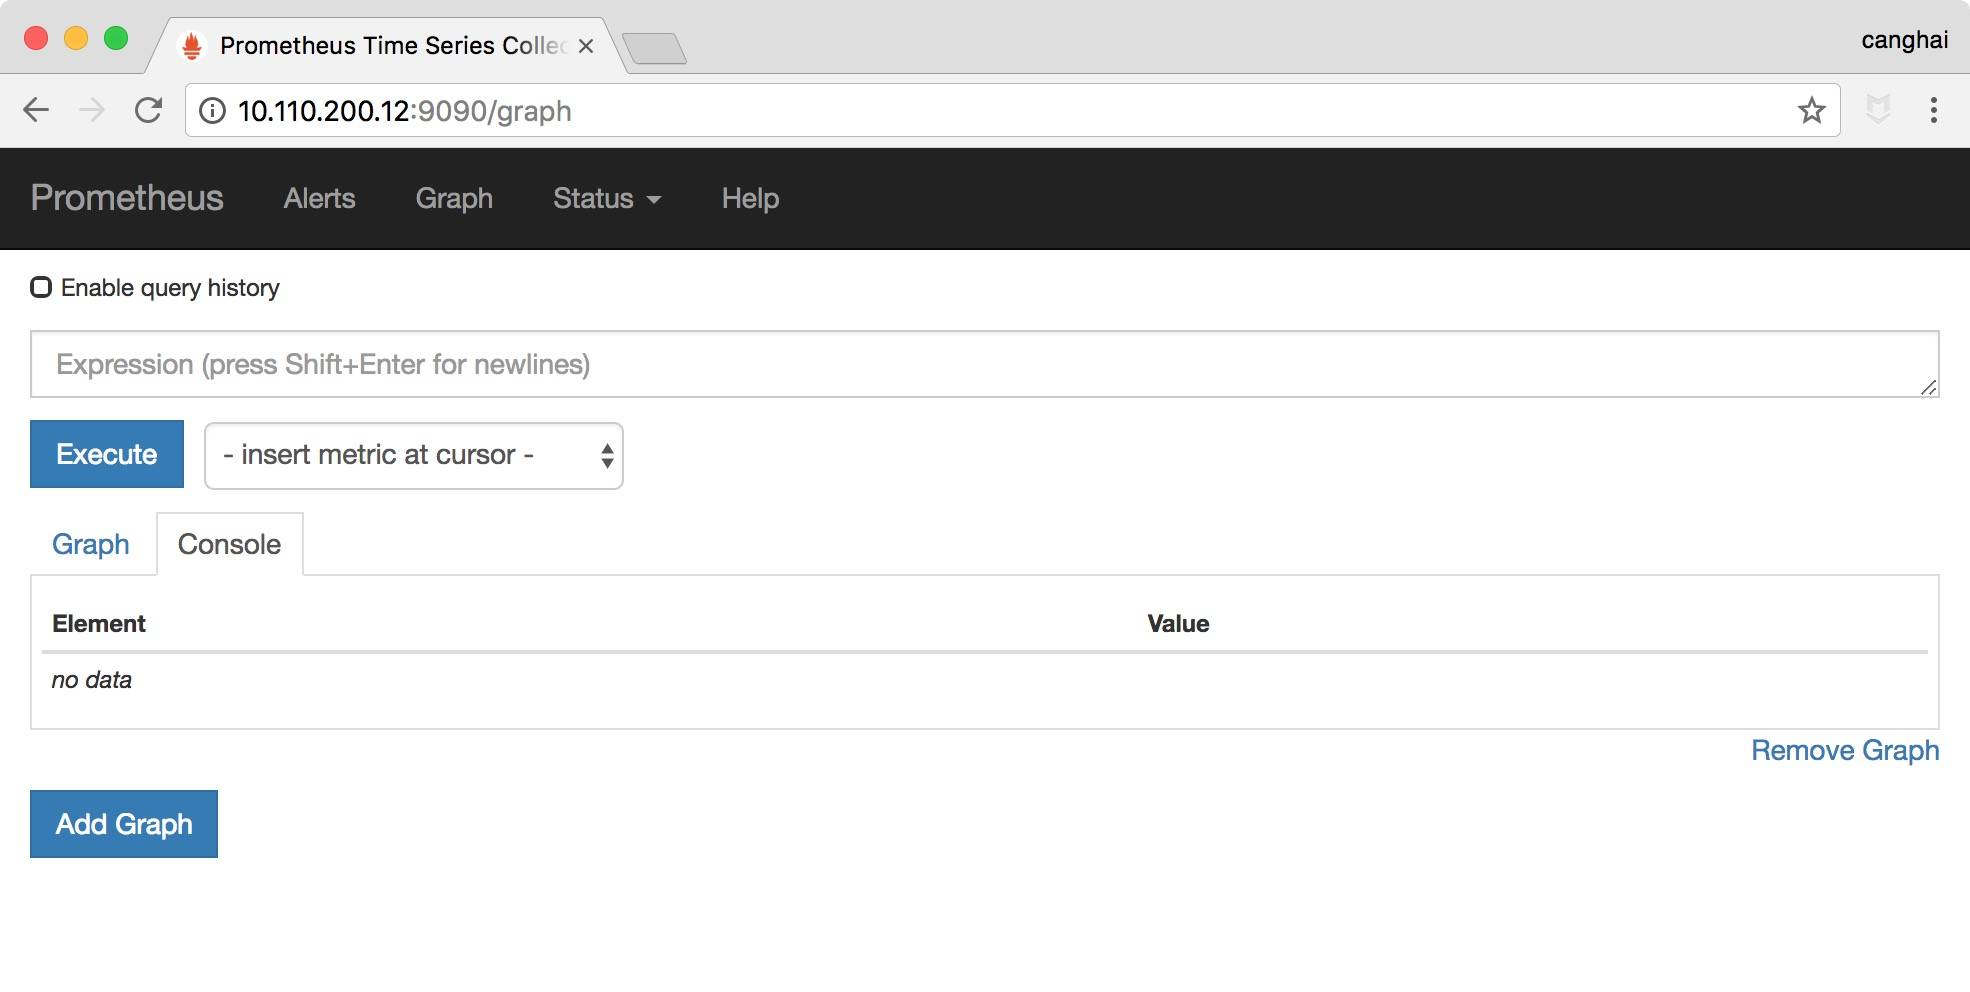
即可启动 prometheus,默认端口为 9090.通过浏览器可以看到如下页面,表示 prometheus 启动正常
基本操作
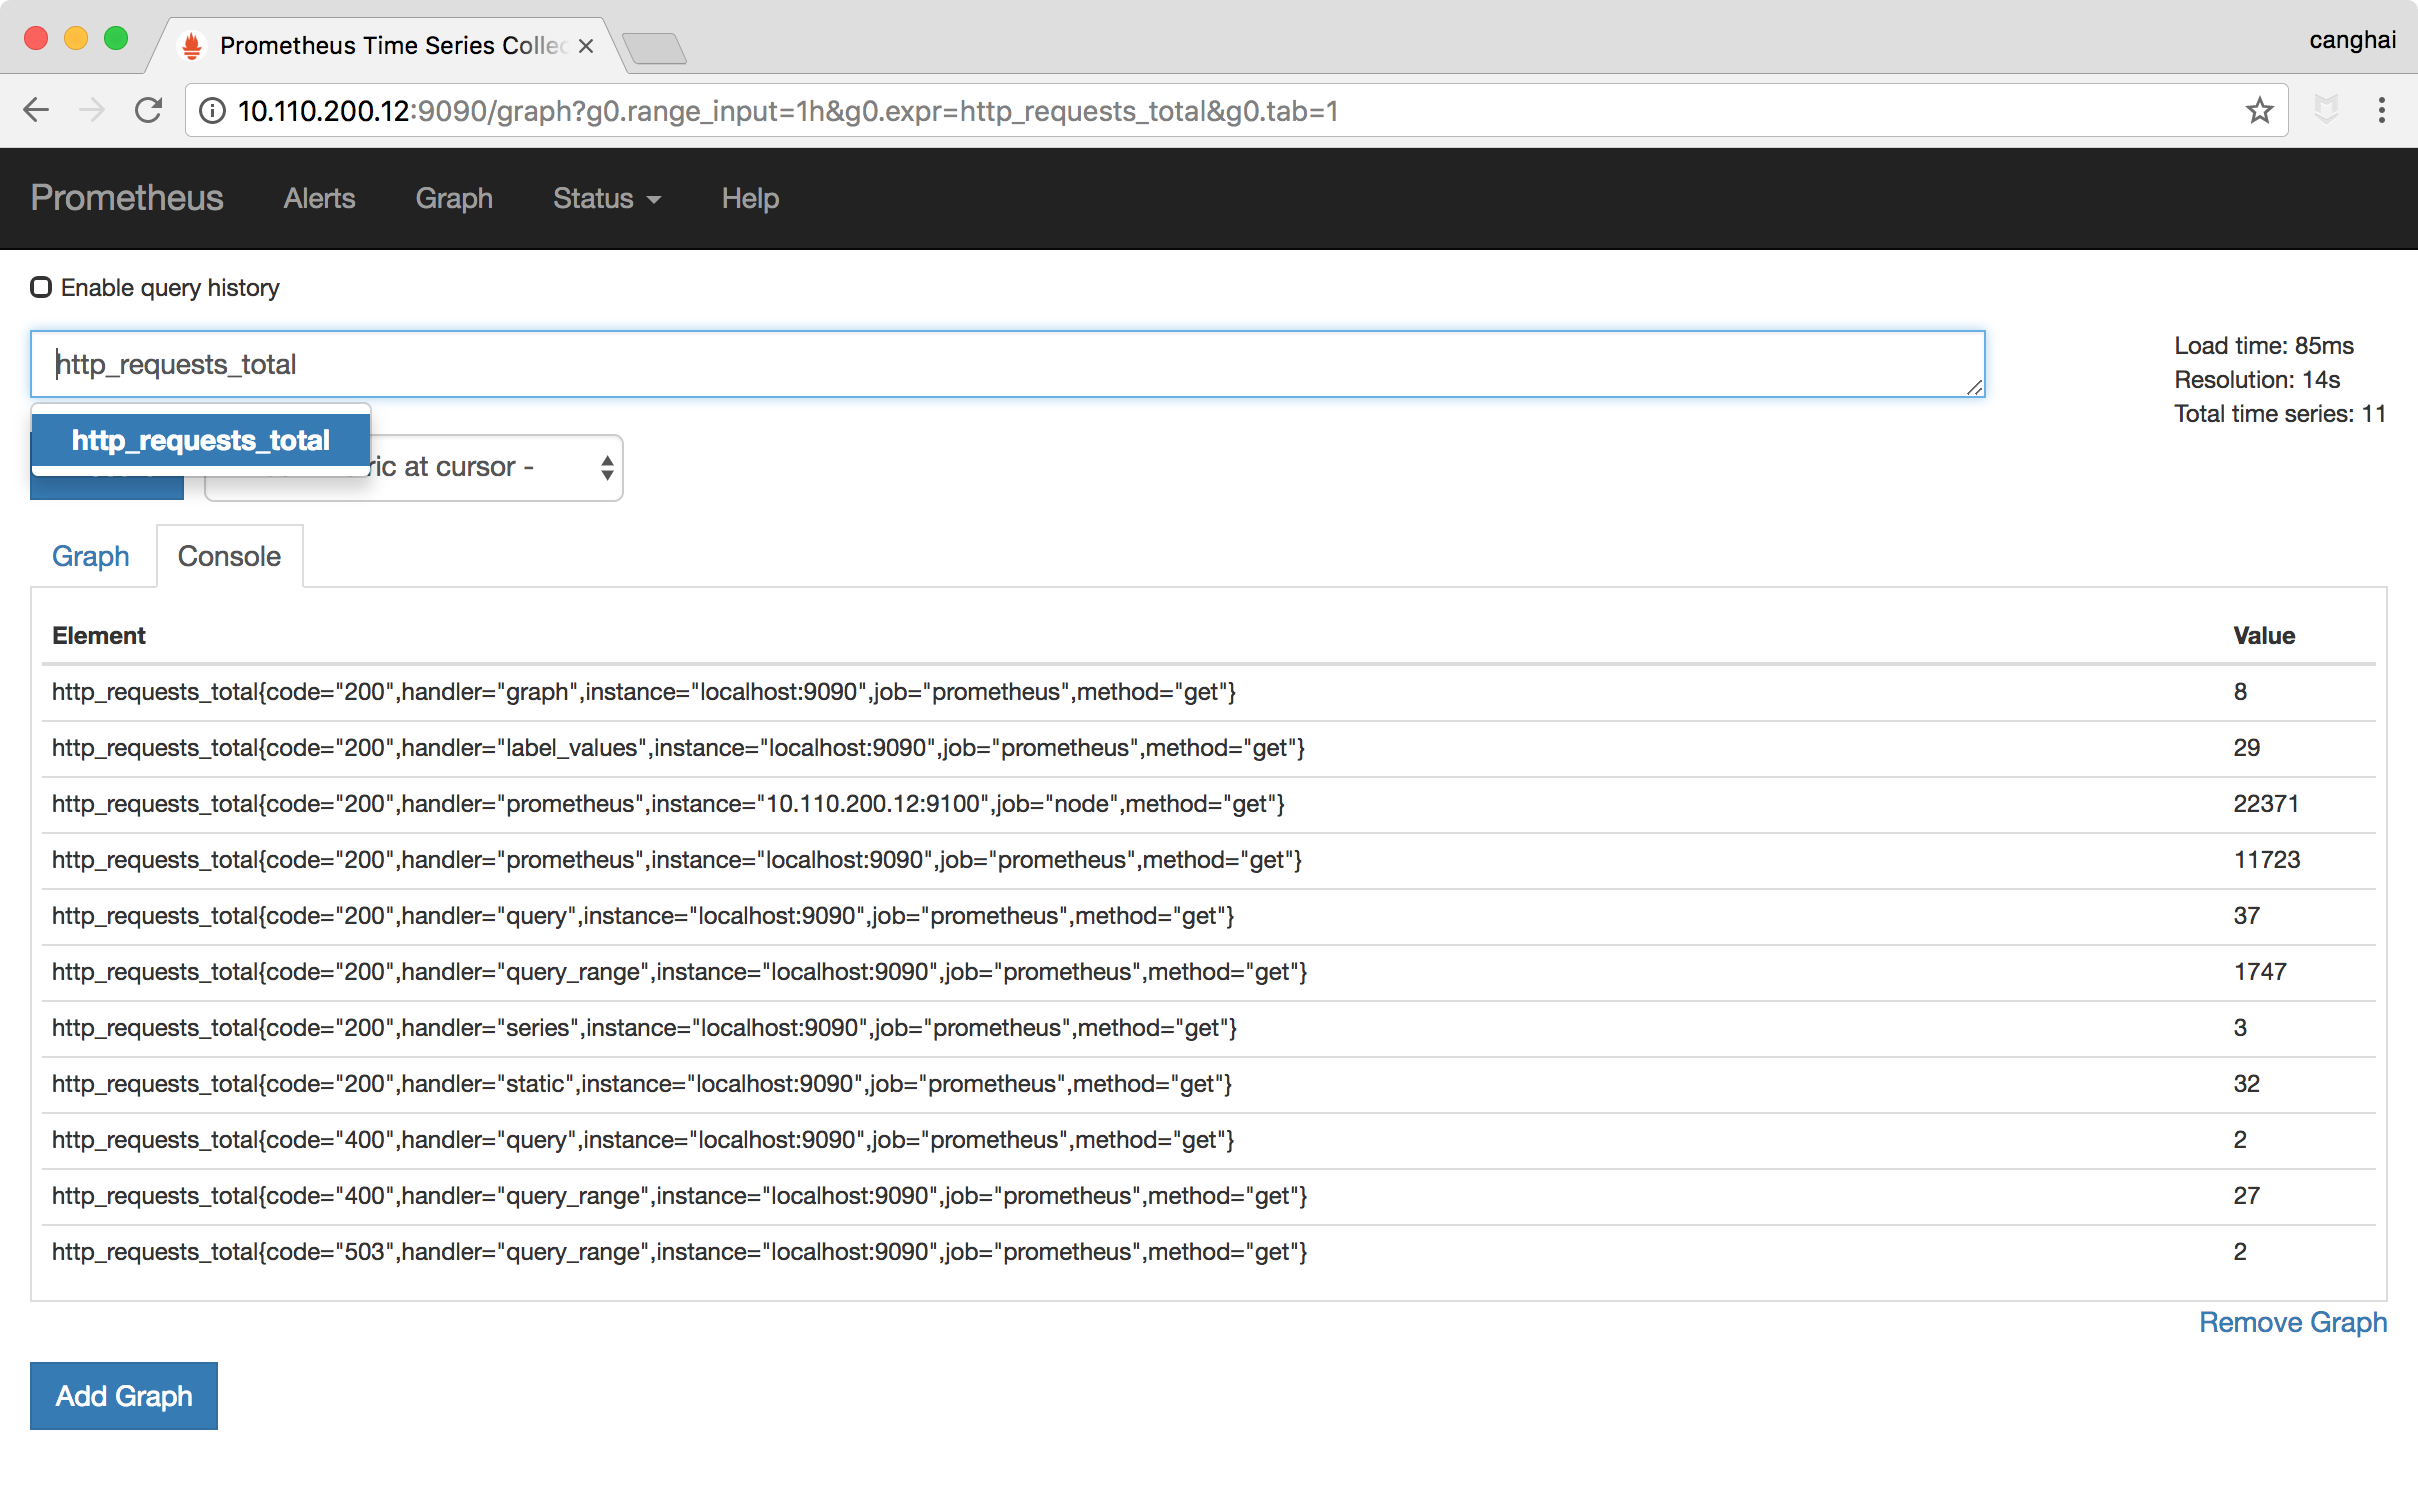
在 Expressioni 里输入输入 http_requests_total,点击 Execute,即可看到 http_requests_total 相关的指标及其监控指标,点击 Graph 即可将指标已图标形式显示。
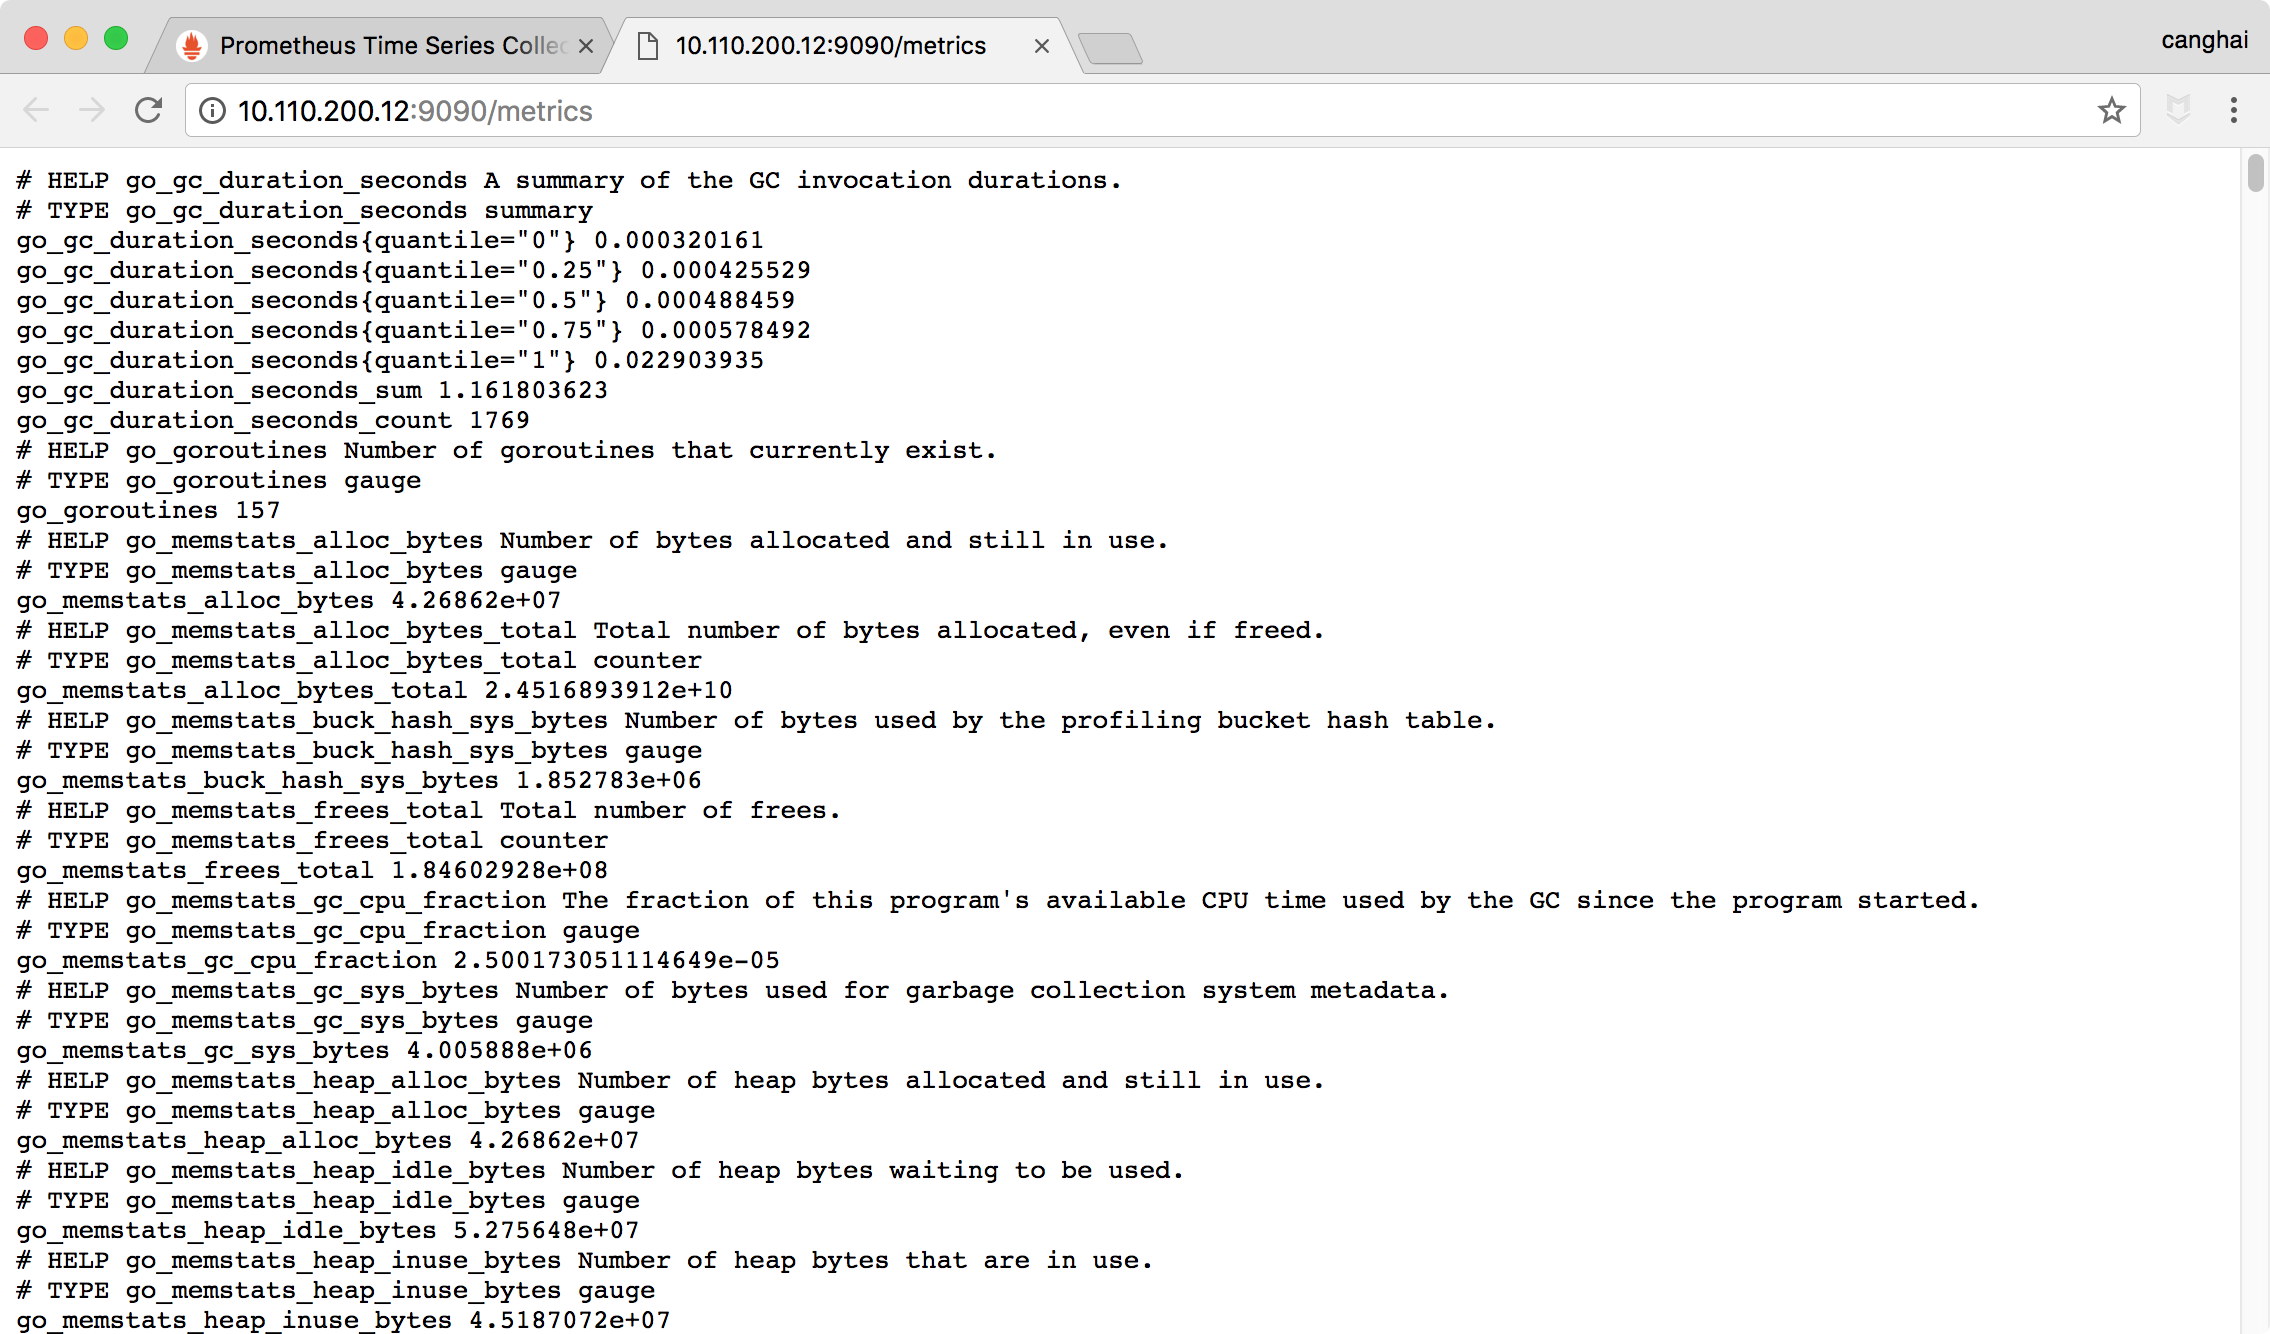
metrics 是 prometheus 的重要概念,metrics 可理解为监控指标,prometheus 运行之后,本省自带很多 metrics 指标,可以反应出 prometheus 本身的一些运行情况,可以通过http://IP:9090/metrics
查看所有指标列表及数值,上面的 http_requests_total 就是 prometheus 自带的计算 Prometheus 的 http 处理的总请求数
prometheus 里还可以通过 count,reate 等函数对 metrics 指标进行计算。具体的函数比较多,可以在https://prometheus.io/docs/prometheus/latest/querying/functions/这里查看。
##主机监控
Prometheus 官网有很多 exporter,exporter 可以理解为客户端,即采集指标,通过 http 方式暴露 metrics 给 prometheus,Prometheus 通过 pull 方式拉去这些指标。Prometheus 默认提供了一个 node_exporter,用于监控主机的指标。下载地址https://dl.cactifans.com/prometheus/node_exporter-0.15.2.linux-amd64.tar.gz
下载之后解压,直接运行
tar zxvf node_exporter-0.15.2.linux-amd64.tar.gz
cd node_exporter-0.15.2.linux-amd64.tar.gz
./node_exporter
即可启动 node_exporter,默认端口为 9100,访问http://ip:9100/metrics
即可查看所有 metrics 指标。具体指标及使用可以查看https://github.com/prometheus/node_exporter
的说明,启动 node_exporter 之后,需要修改 prometheus 配置文件,添加 jobs,以便 prometheus 能够拉去指标,修改 prometheus 配置文件,添加以下内容,注意:由于 prometheus 配置文件为 yaml 格式,对于空格,换行有严格限制,编译时一定要注意空格或换行
- job_name: 'node'

# metrics_path defaults to '/metrics'
# scheme defaults to 'http'.

static_configs:
- targets: ['10.110.200.12:9100']
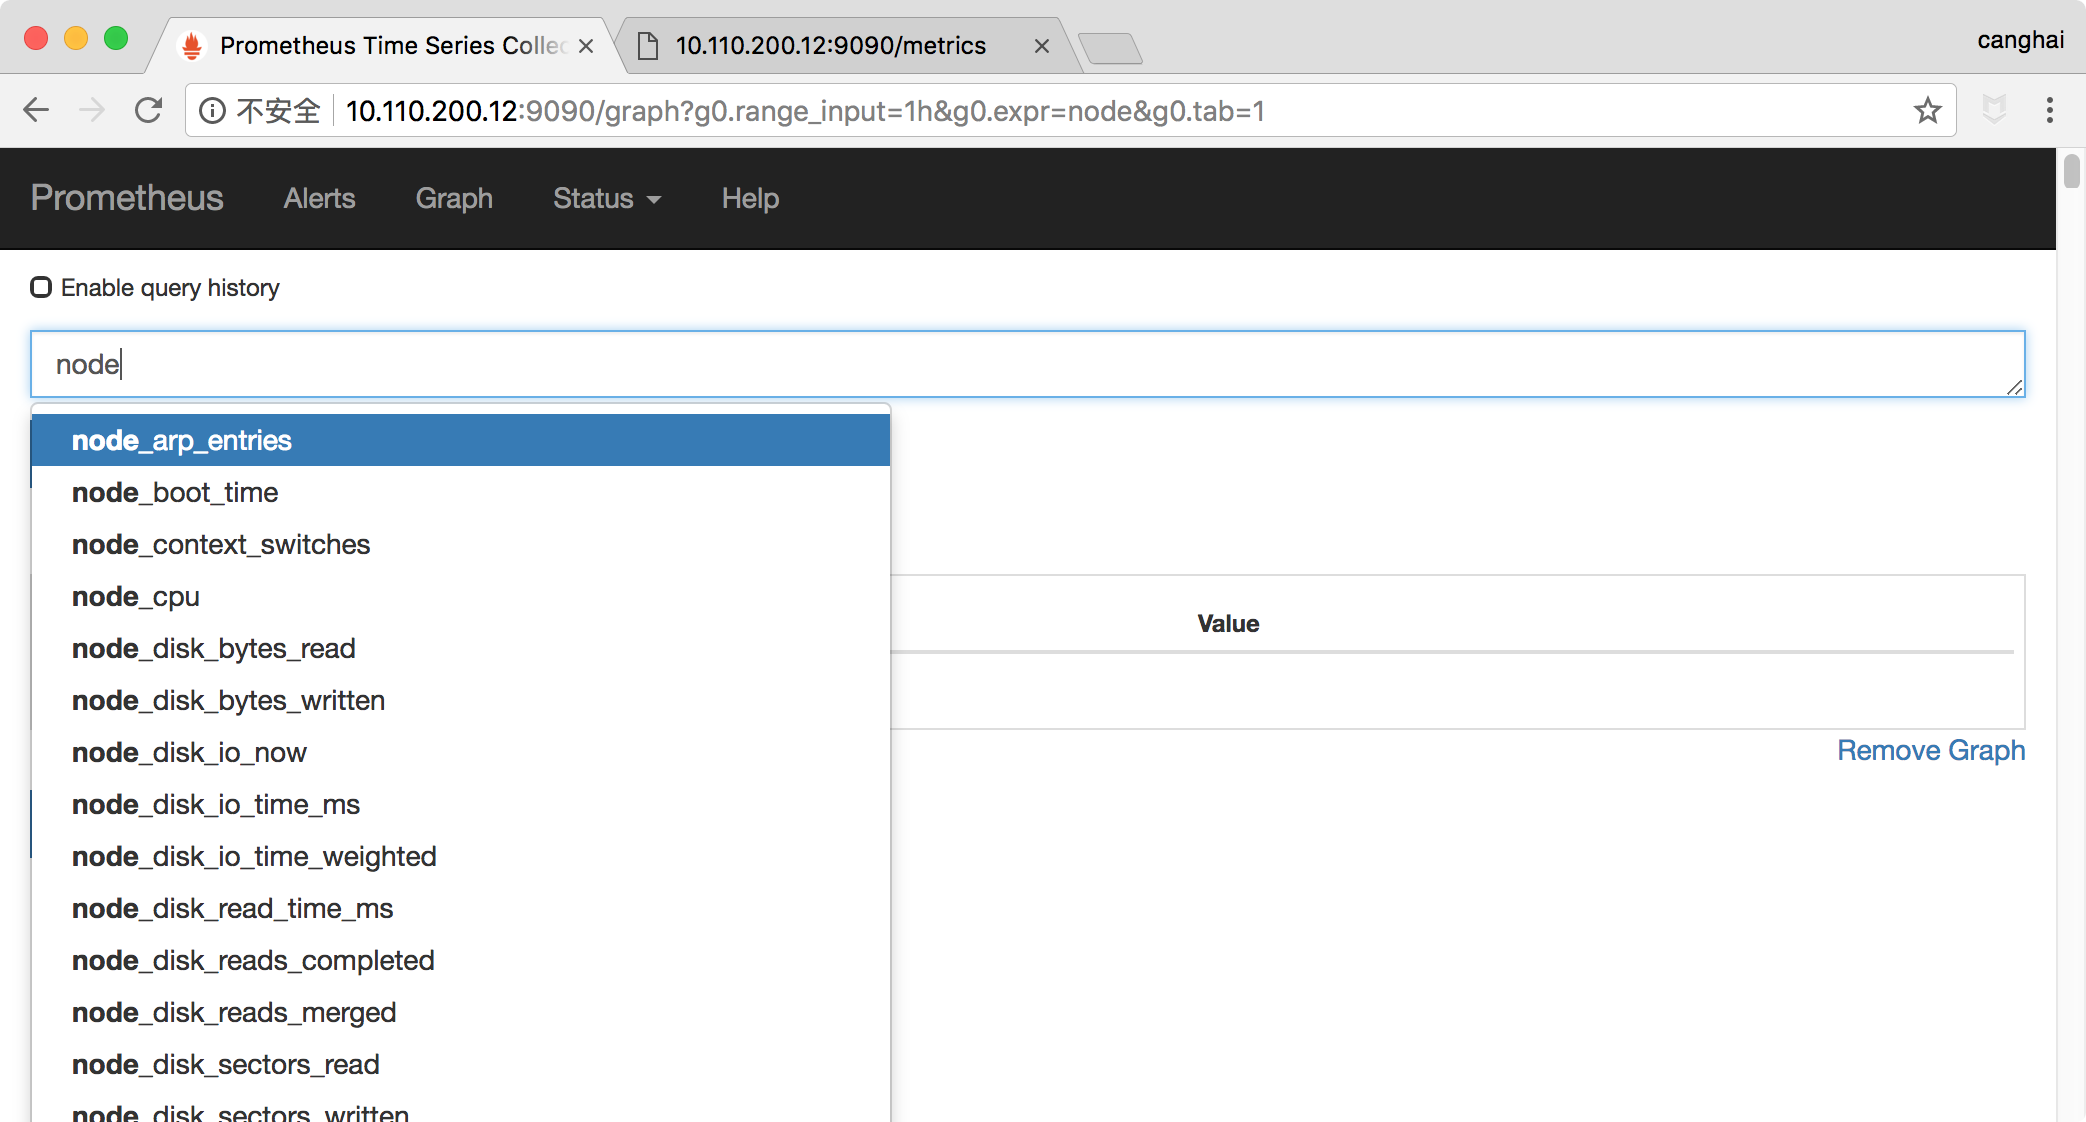
添加之后重启 prometheus.过一段时间之后可以在 prometheus 界面,输入 node,如看到如图,表示 node 的信息已经采集。
展示
prometheus 的绘图功能比较弱,如何才能使展示效果做到高大上呢?这里就要使用 Grafana.借助与 Grafana 可以完全自定义属于自己的 Dashboard。Grafana 的安装及配置比较简单,我这直接使用 Centos7 的 rpm 进行安装,安装之后,直接启动。Grafana 下载地址:https://dl.cactifans.com/grafana/grafana-4.6.3-1.x86_64.rpm
大致安装过程
yum install urw-fonts -y
rpm -ivh grafana-4.6.3-1.x86_64.rpm
systemctl daemon-reload
systemctl enable grafana-server.service
systemctl start grafana-server.service
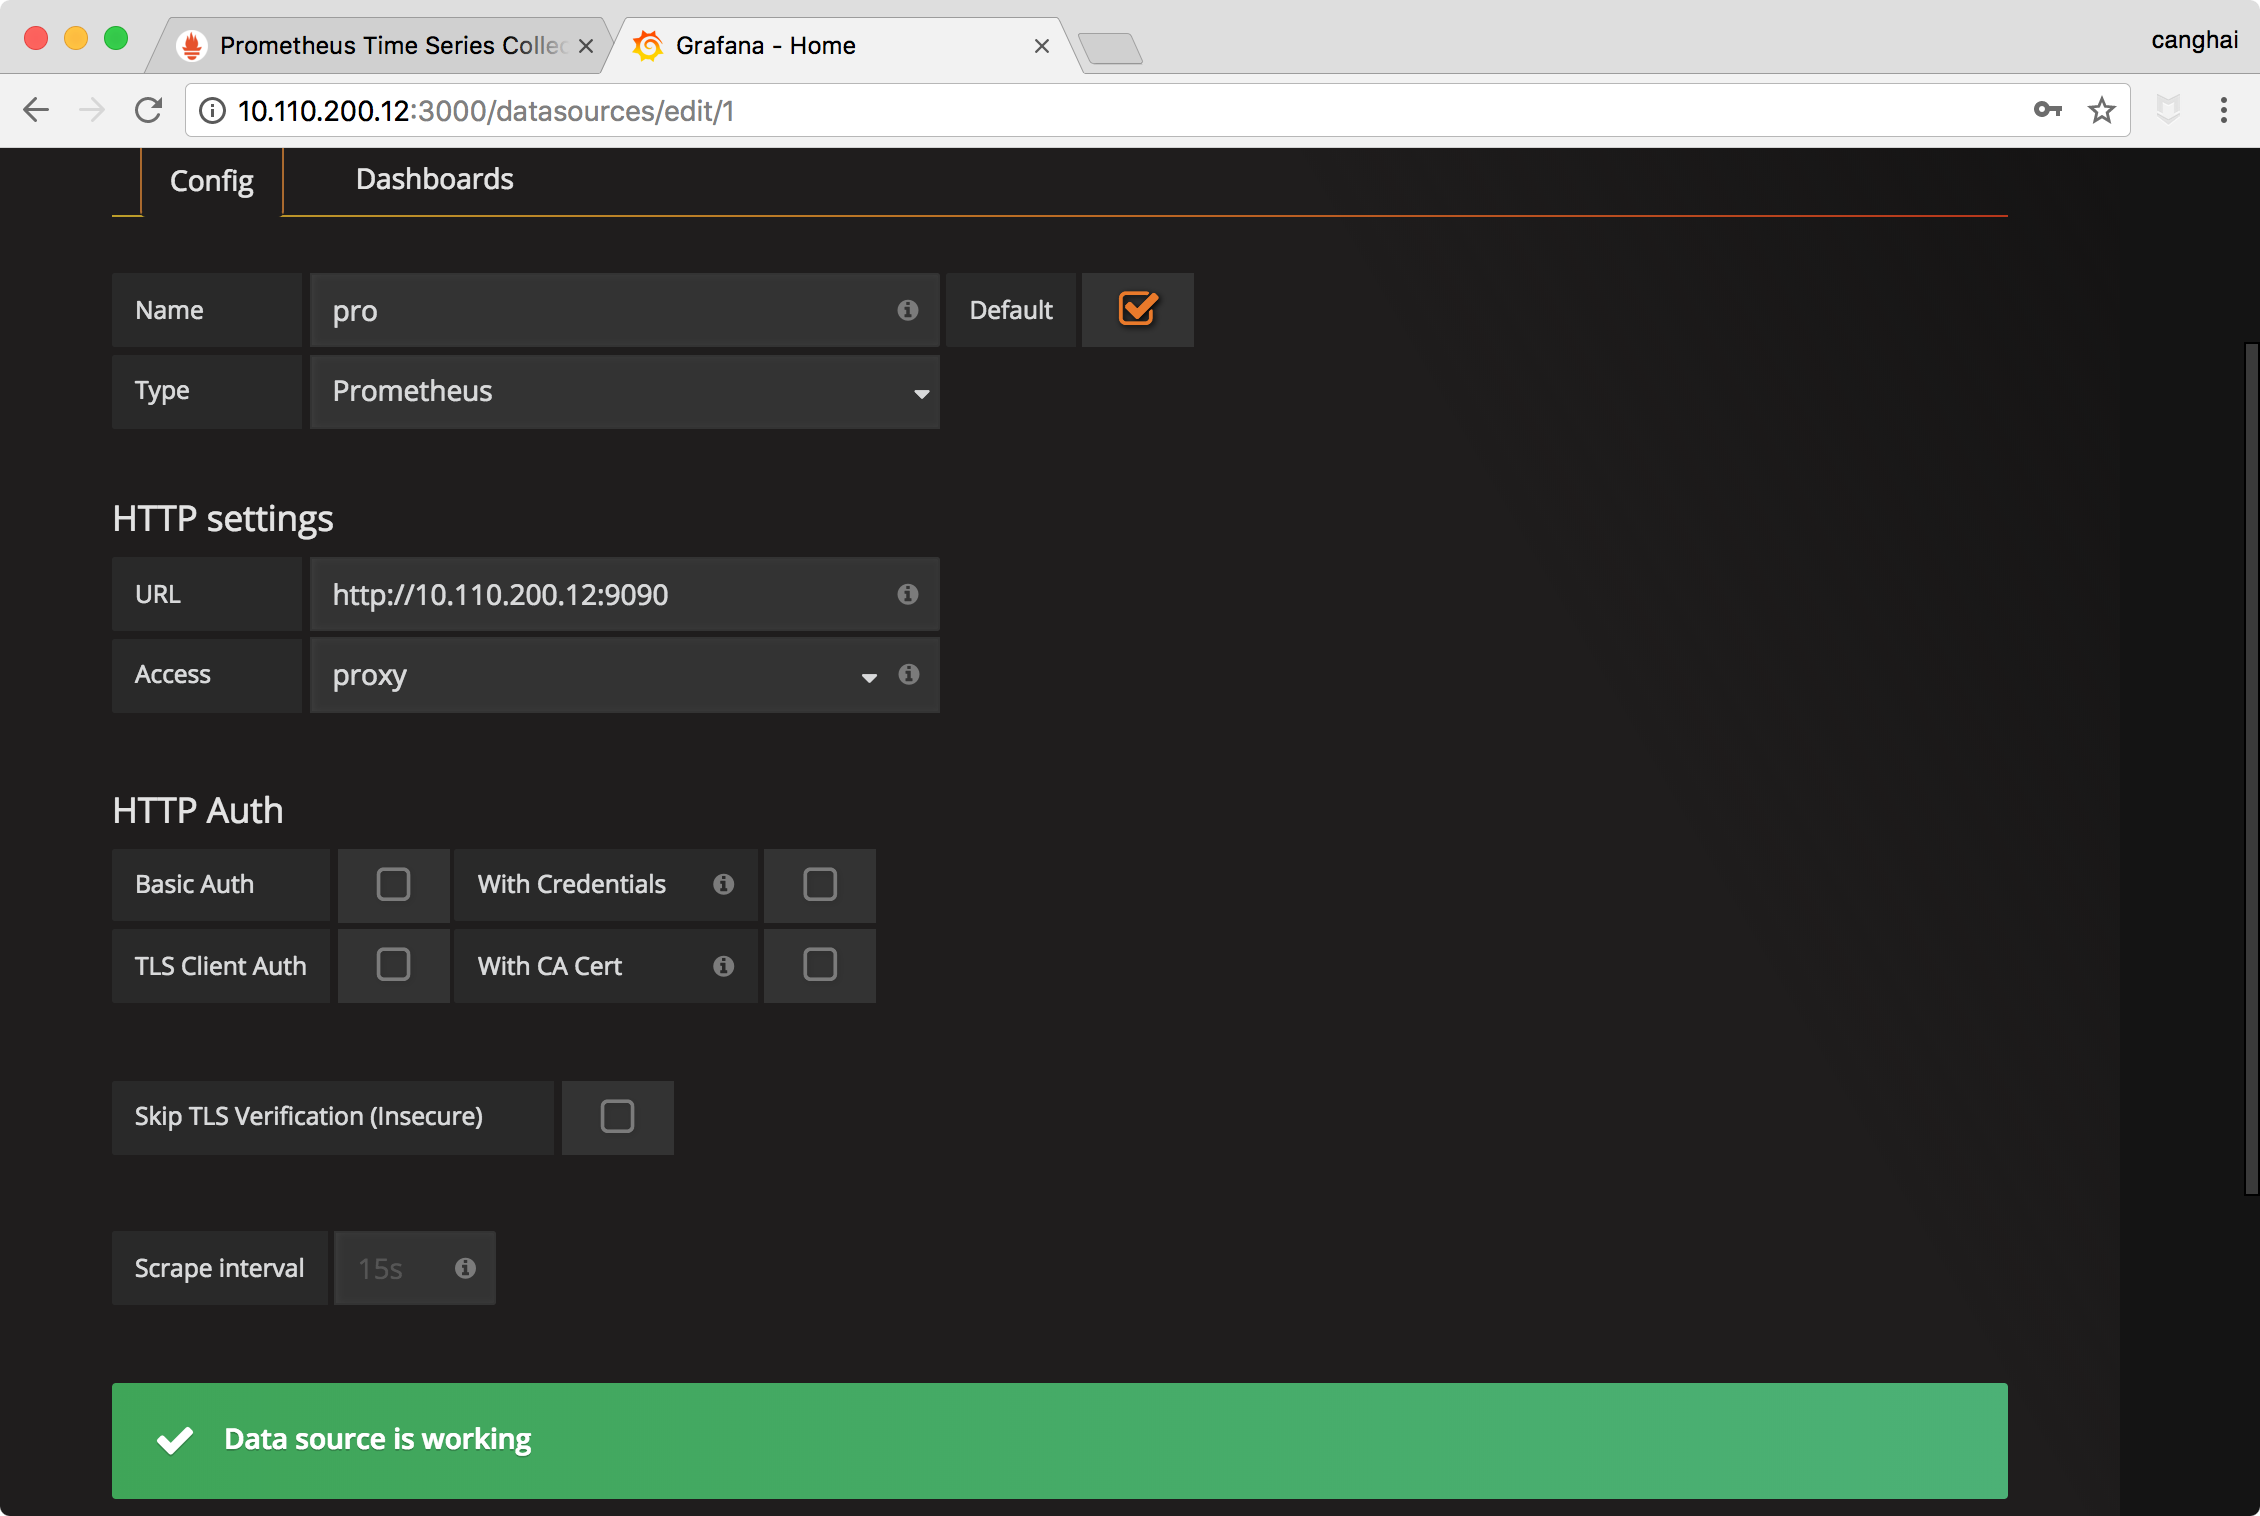
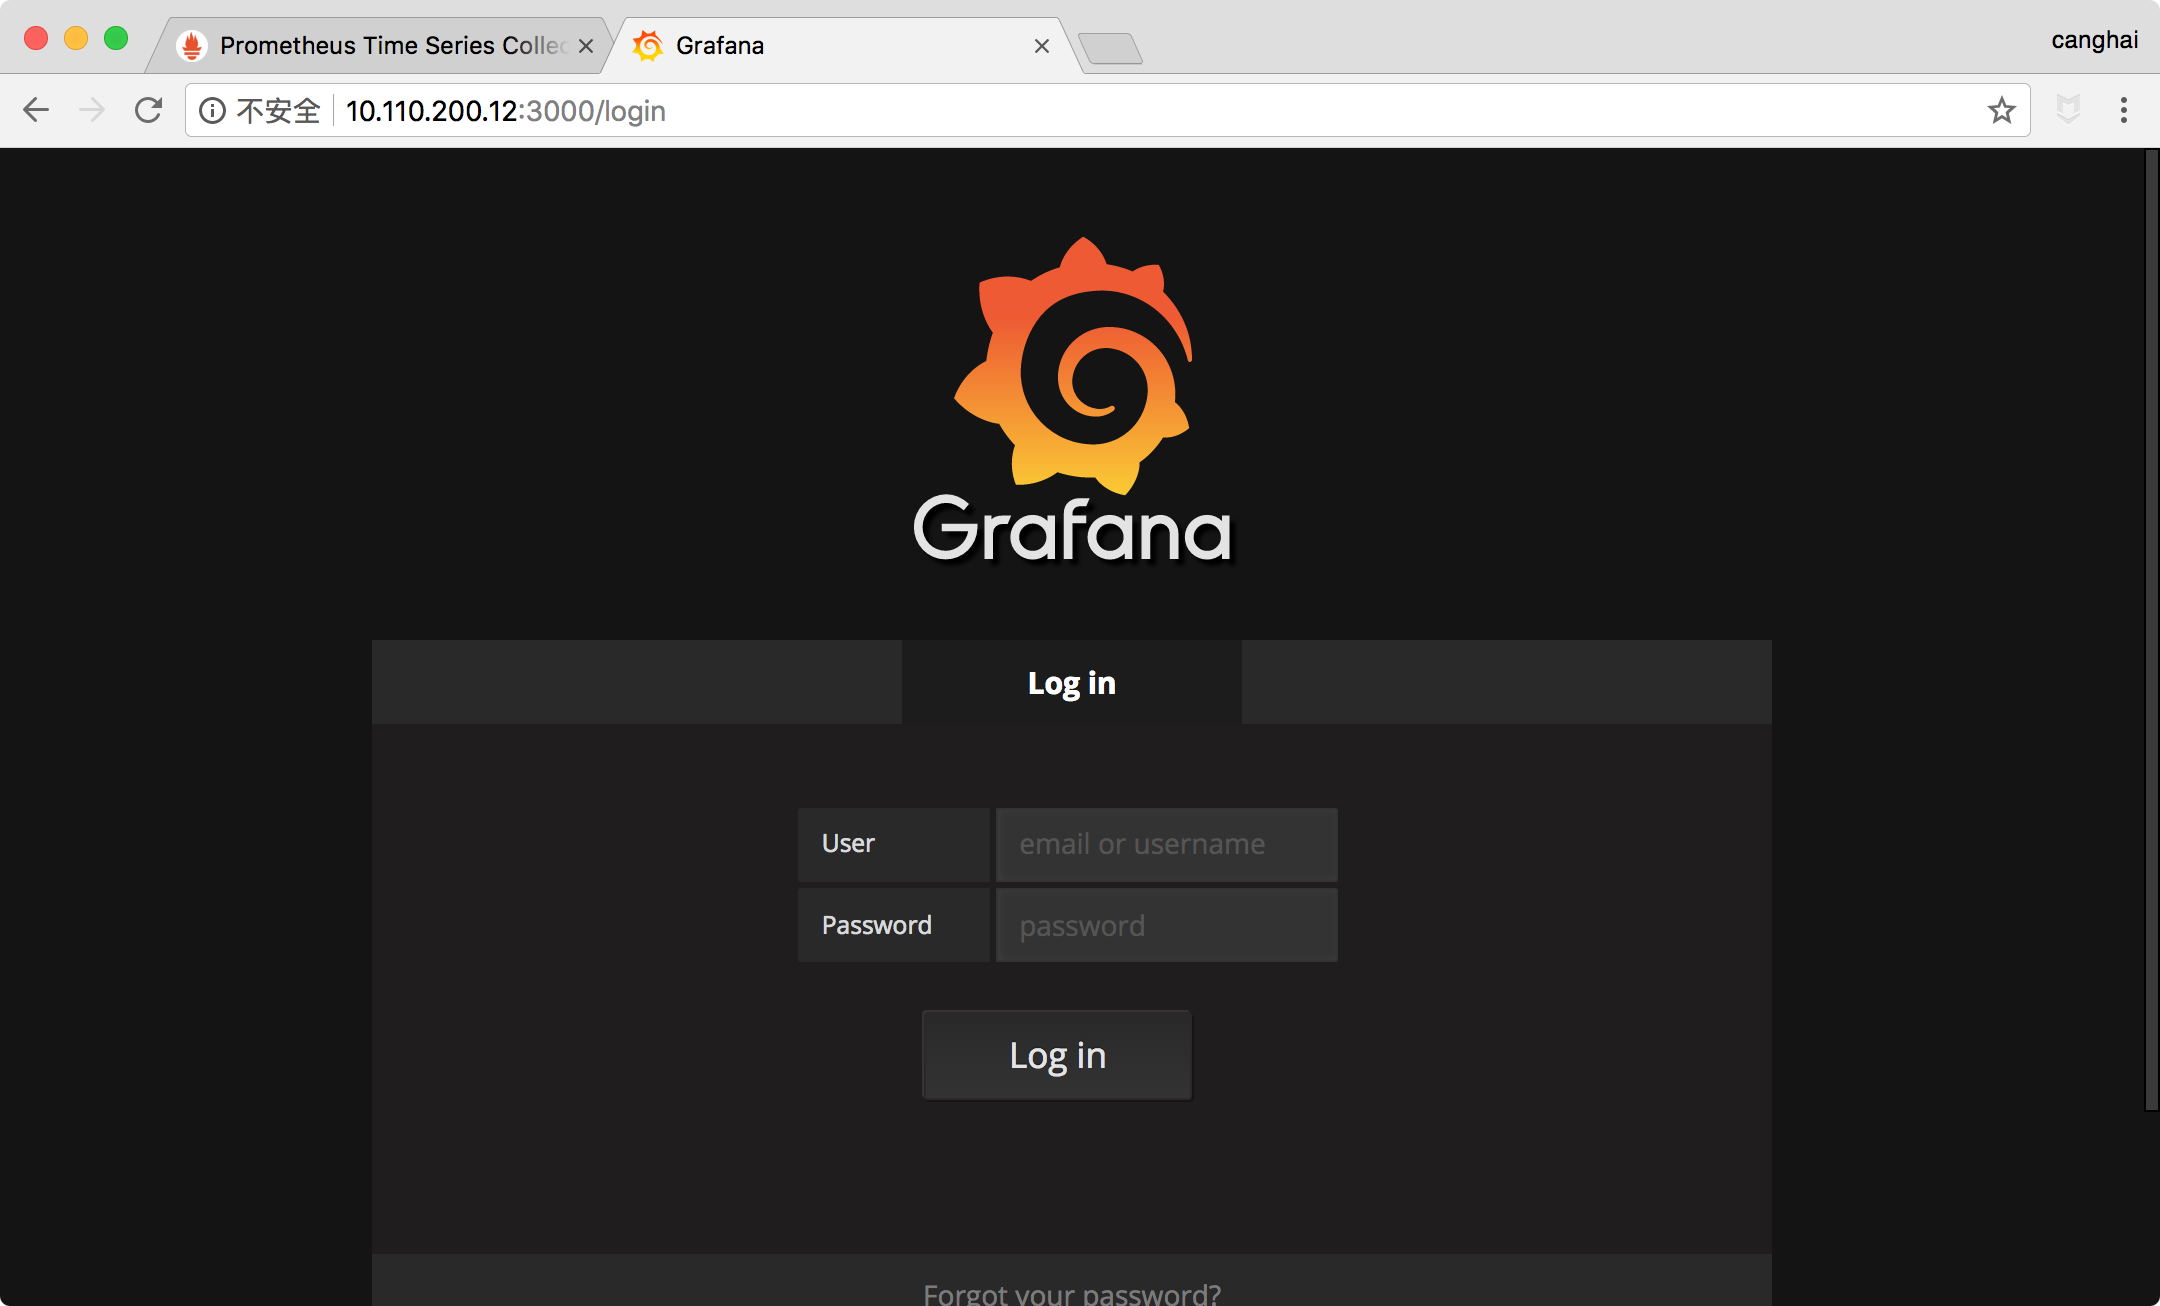
即可完成 Grafana 的安装,Grafana 默认端口为 3000,默认用户为 admin,密码为 admin,登录点击右侧菜单,添加数据源。Grafana 默认已支持 prometheus 的数据源,填写之前安装的 prometheus 地址,点击 save&test,如果没有问题,表示配置成功。
配置成功之后,可以对 prometheus 的 metrics 指标进行绘图,配合 prometheus 自带的函数,可以定制出自己的 dashboard,由于 Grafana 功能比较多,就不一一介绍,我们直接倒入别人已经做好的 prometheus node exporter 配置图,就可直接展示。Dashboard 模版下载地址https://grafana.com/dashboards/159 可以通过模版 ID 方式安装,或者瞎子啊模版 json 格式。下载 json 格式模版之后,点击 Dashboard,再点击 import,导入之前的 json 格式模版。
导入成功之后,切换到新的 Dashboard,即可看到效果。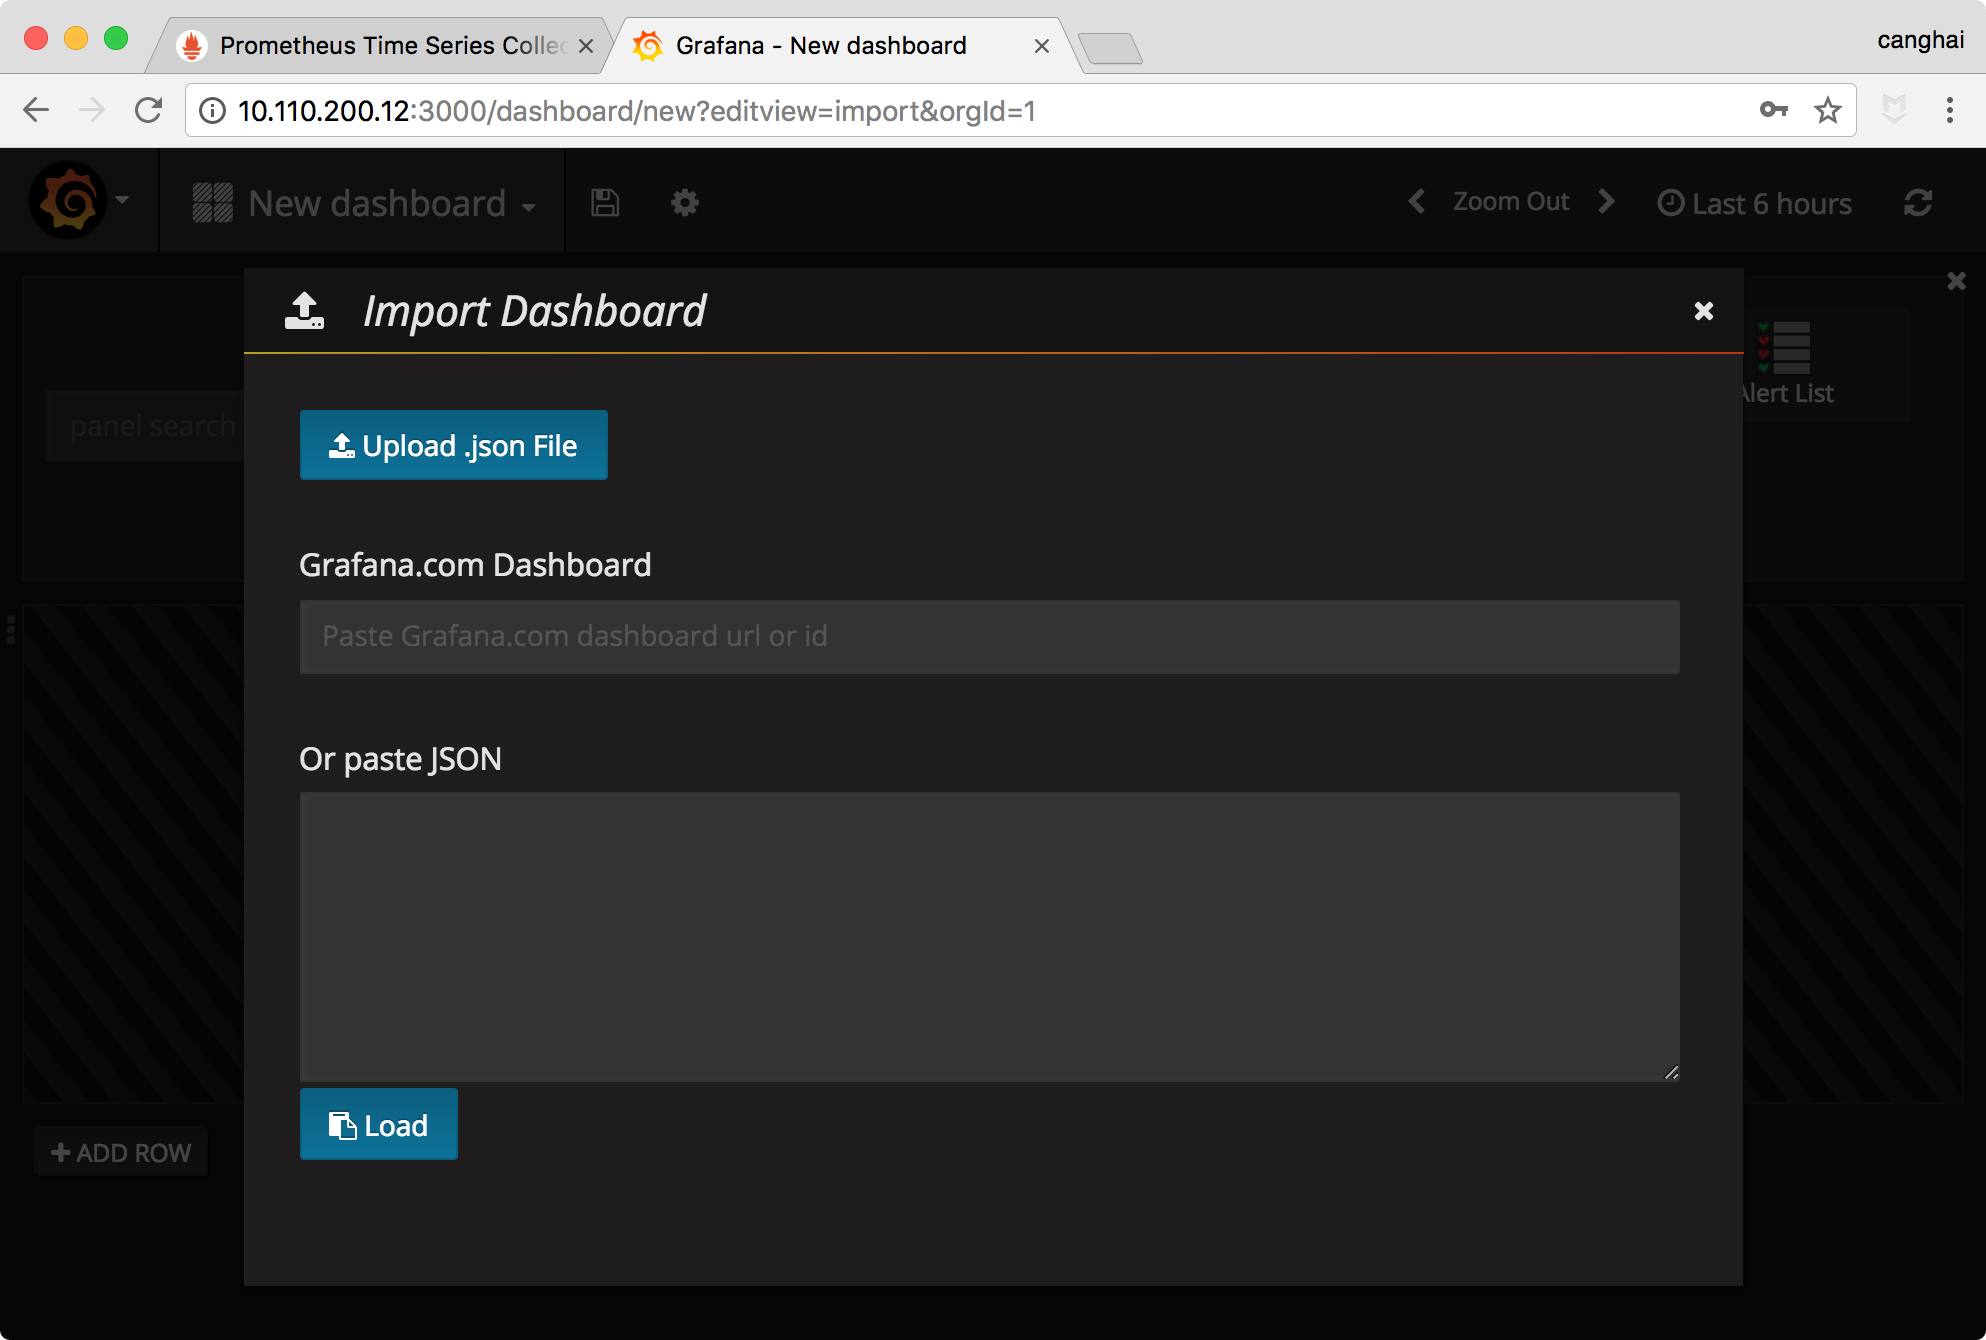
 是不是很炫酷?prometheus 及 grafana 功能较多,今天就介绍到这里,后续会陆续推出相关文章。